> ## Documentation Index
> Fetch the complete documentation index at: https://help.kneadapp.co/llms.txt
> Use this file to discover all available pages before exploring further.
# Your Profit and Loss Report
> See your revenue, fees, and expenses for any period in one report.
## Overview
Your Profit & Loss (P\&L) report is the quickest way to answer "Am I actually making money?" It pulls together the money you've received and the money you've spent over a period you choose, then shows your net profit at the bottom. It's built on a cash-basis, which means it counts payments you actually received — not invoices you've sent but haven't been paid for yet.
## Where to Find Your P\&L
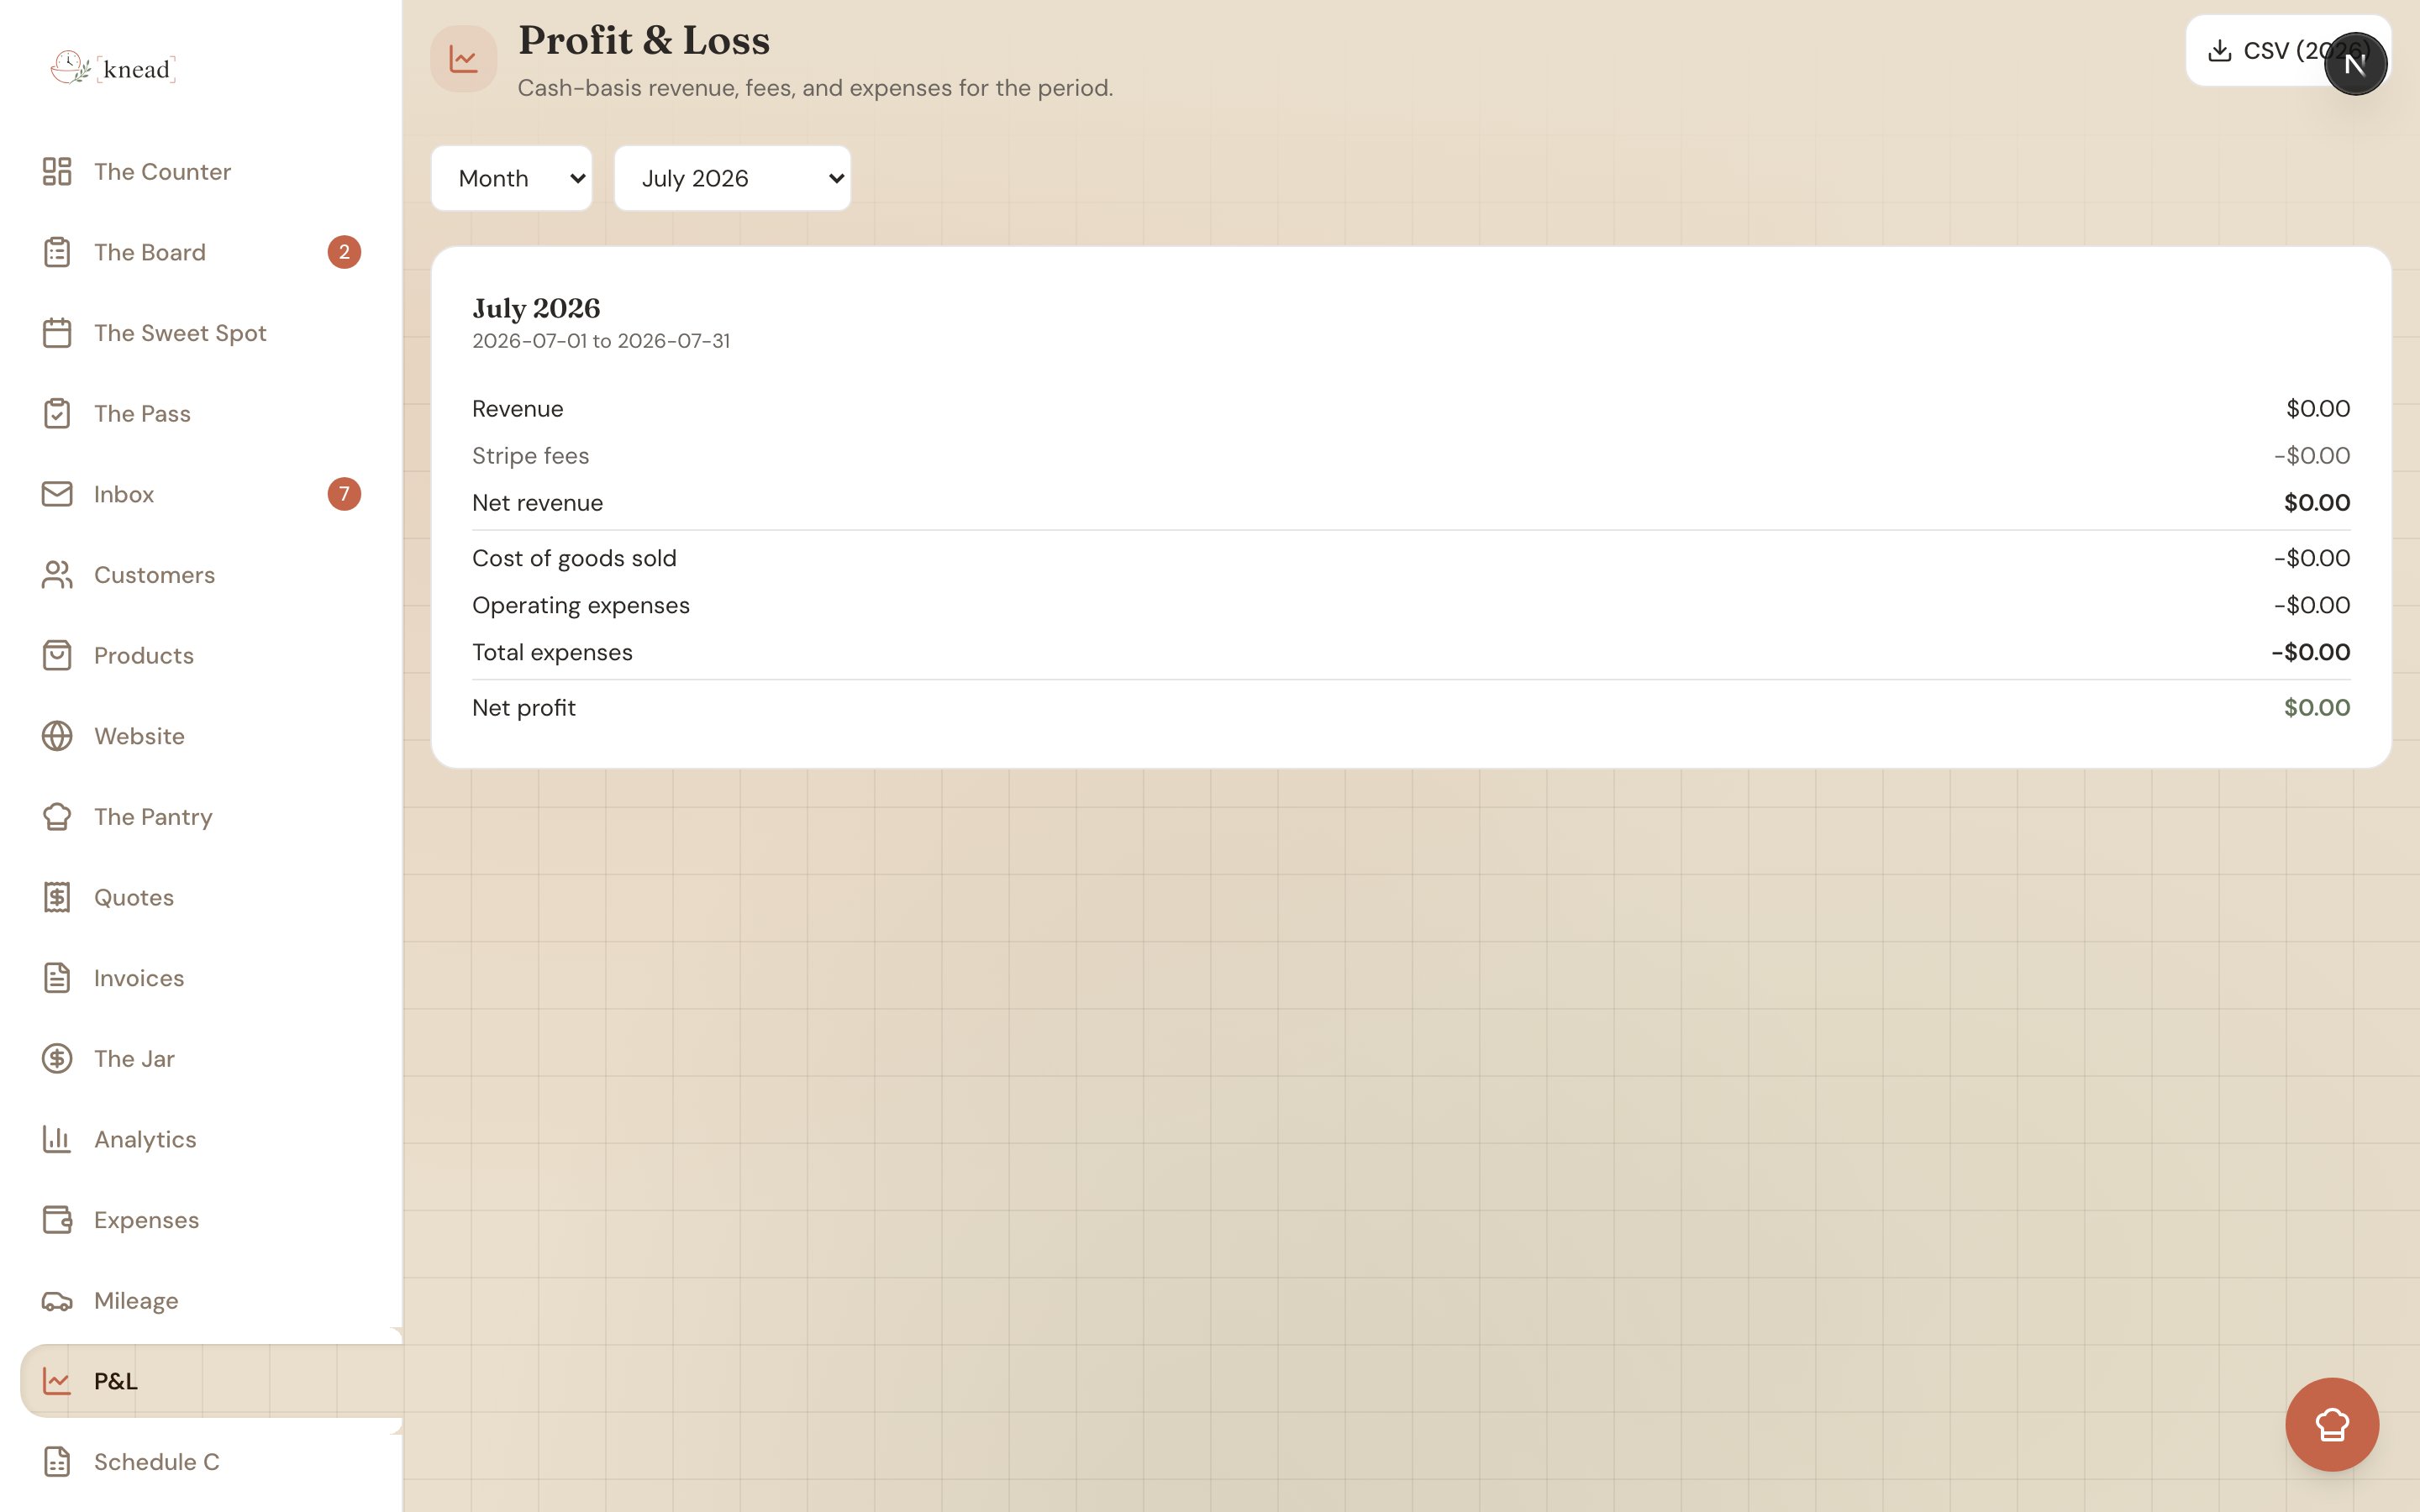
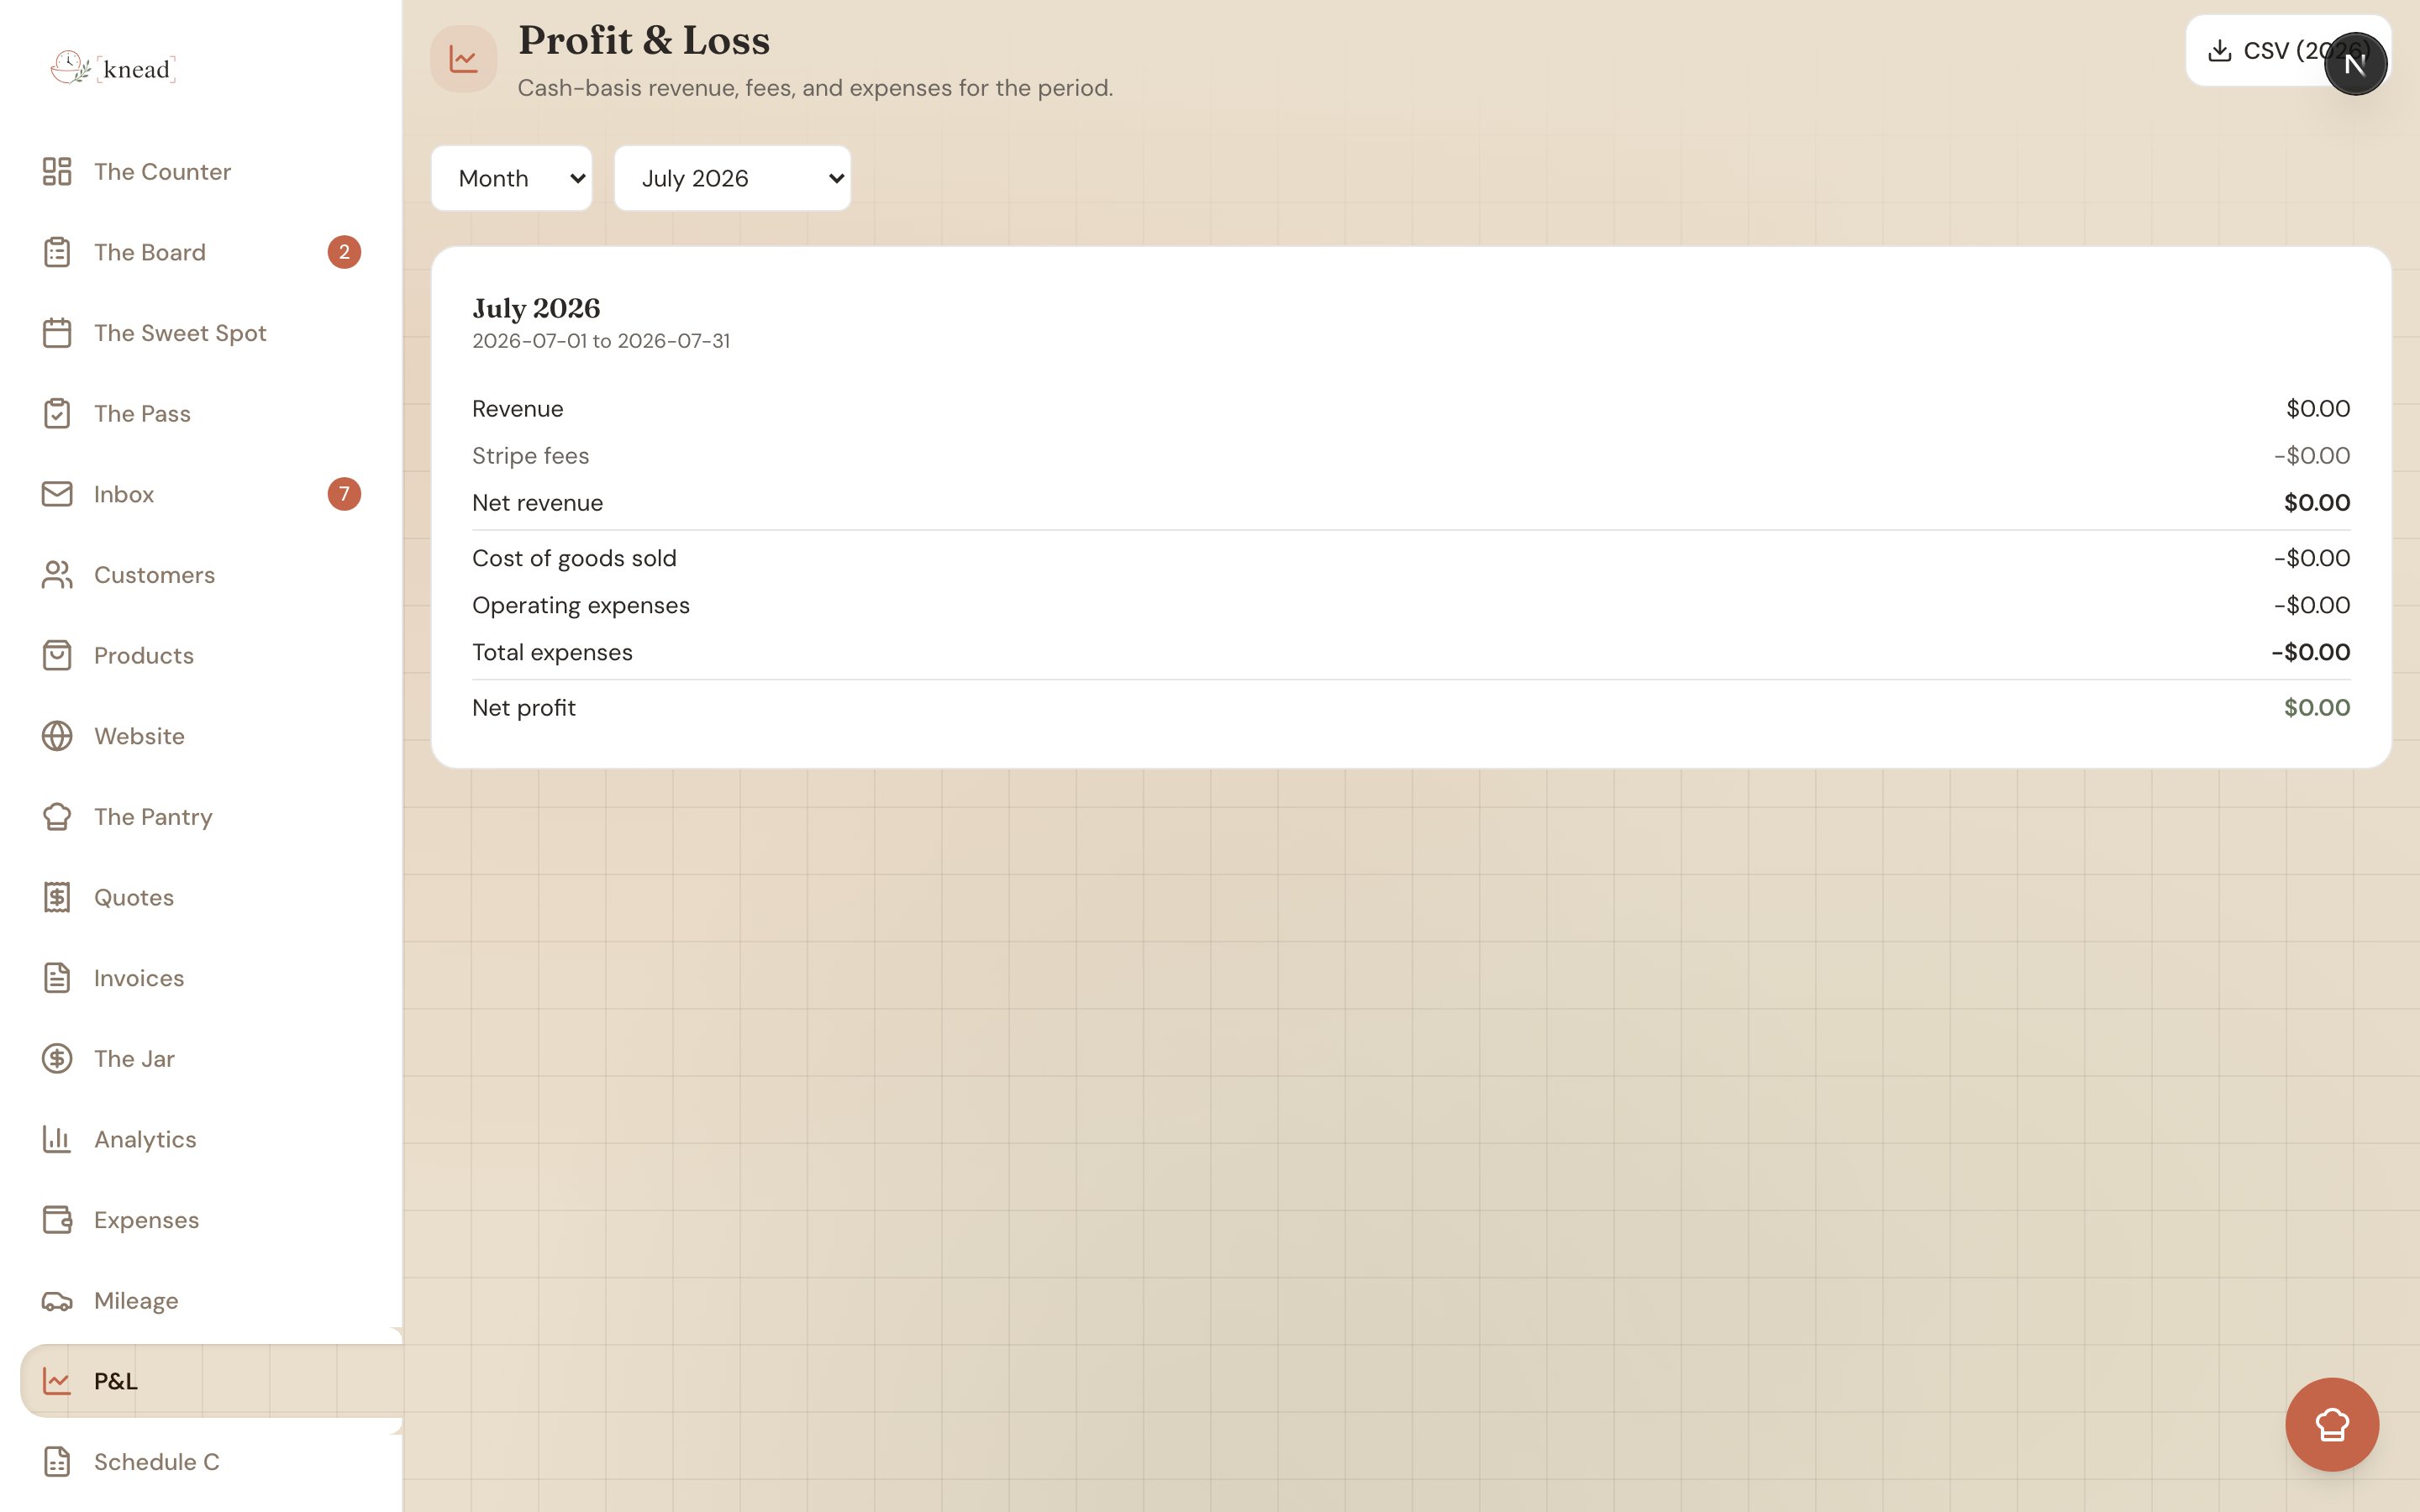
Tap **P\&L** in the sidebar to open `/reports/profit-loss`. The page is titled "Profit & Loss" with the description "Cash-basis revenue, fees, and expenses for the period."
 ## Choosing a Period
Use the period picker to switch between **Month**, **Quarter**, and **Year**, then pick the specific month or year. Quarters are labeled by their months — **Q1 (Jan–Mar)**, **Q2 (Apr–Jun)**, **Q3 (Jul–Sep)**, and **Q4 (Oct–Dec)** — so there's no guessing which quarter is which.
## Reading the Report
The report rows appear in this order:
| Row | What it shows |
| ---------------------- | -------------------------------------- |
| **Revenue** | Payments received in the period |
| **Stripe fees** | Processing fees (shown as a negative) |
| **Net revenue** | Revenue minus fees |
| **Cost of goods sold** | Direct product costs (COGS categories) |
| **Operating expenses** | Everything else you spent |
| **Total expenses** | COGS plus operating expenses |
| **Net profit** | What's left — your bottom line |
Your **Net profit** shows in green when it's zero or positive, and in terracotta when it's negative.
Below the totals, you'll find a **COGS by category** breakdown and an **Operating expenses by category** breakdown so you can see exactly where the money went.
## Choosing a Period
Use the period picker to switch between **Month**, **Quarter**, and **Year**, then pick the specific month or year. Quarters are labeled by their months — **Q1 (Jan–Mar)**, **Q2 (Apr–Jun)**, **Q3 (Jul–Sep)**, and **Q4 (Oct–Dec)** — so there's no guessing which quarter is which.
## Reading the Report
The report rows appear in this order:
| Row | What it shows |
| ---------------------- | -------------------------------------- |
| **Revenue** | Payments received in the period |
| **Stripe fees** | Processing fees (shown as a negative) |
| **Net revenue** | Revenue minus fees |
| **Cost of goods sold** | Direct product costs (COGS categories) |
| **Operating expenses** | Everything else you spent |
| **Total expenses** | COGS plus operating expenses |
| **Net profit** | What's left — your bottom line |
Your **Net profit** shows in green when it's zero or positive, and in terracotta when it's negative.
Below the totals, you'll find a **COGS by category** breakdown and an **Operating expenses by category** breakdown so you can see exactly where the money went.
 ## Drilling Into a Row
You don't have to take the totals on faith. The **Revenue** row, the **Stripe fees** row, and **each category** row are expandable — click one open to see the individual transactions behind it. Each underlying line shows:
* The **date**
* The **client** (for revenue) or **vendor** (for expenses)
* Whether it was **Card** or **Manual**
* The **amount**
This makes it easy to answer "where did that number come from?" without leaving the report — and to spot a miscategorized expense at a glance.
## Drilling Into a Row
You don't have to take the totals on faith. The **Revenue** row, the **Stripe fees** row, and **each category** row are expandable — click one open to see the individual transactions behind it. Each underlying line shows:
* The **date**
* The **client** (for revenue) or **vendor** (for expenses)
* Whether it was **Card** or **Manual**
* The **amount**
This makes it easy to answer "where did that number come from?" without leaving the report — and to spot a miscategorized expense at a glance.
 ## Exporting for Your Accountant
Tap the **CSV** button to download the year's figures as `profit-loss-{year}.csv` — a spreadsheet you can hand straight to your bookkeeper. The same one-tap CSV export lives on your Expenses, Mileage, and Jar → Payments screens too. See [Exporting Reports for Your Accountant](/bookkeeping-and-taxes/exporting-reports-for-your-accountant).
## What "Cash-Basis" Means
Cash-basis accounting counts money when it actually changes hands. So an invoice you sent in March but got paid for in April shows up in April's P\&L — not March's. This keeps the report tied to the cash that's really in your account.
Good to know: Because the P\&L is cash-basis, an unpaid invoice doesn't count as revenue until the payment lands. That's why your P\&L can differ from the total of invoices you've sent.
Pro tip: Run a Quarter view at the end of each quarter to sanity-check your numbers before they pile up at year-end.
## Related Articles
* [Exporting Reports for Your Accountant](/bookkeeping-and-taxes/exporting-reports-for-your-accountant)
* [The Schedule C Worksheet](/bookkeeping-and-taxes/schedule-c-worksheet)
* [Tracking Business Expenses](/bookkeeping-and-taxes/tracking-business-expenses)
* [The Jar](/invoicing-and-payments/the-jar)
***
*Still need help? [Contact us](mailto:hello@kneadapp.co)*
## Exporting for Your Accountant
Tap the **CSV** button to download the year's figures as `profit-loss-{year}.csv` — a spreadsheet you can hand straight to your bookkeeper. The same one-tap CSV export lives on your Expenses, Mileage, and Jar → Payments screens too. See [Exporting Reports for Your Accountant](/bookkeeping-and-taxes/exporting-reports-for-your-accountant).
## What "Cash-Basis" Means
Cash-basis accounting counts money when it actually changes hands. So an invoice you sent in March but got paid for in April shows up in April's P\&L — not March's. This keeps the report tied to the cash that's really in your account.
Good to know: Because the P\&L is cash-basis, an unpaid invoice doesn't count as revenue until the payment lands. That's why your P\&L can differ from the total of invoices you've sent.
Pro tip: Run a Quarter view at the end of each quarter to sanity-check your numbers before they pile up at year-end.
## Related Articles
* [Exporting Reports for Your Accountant](/bookkeeping-and-taxes/exporting-reports-for-your-accountant)
* [The Schedule C Worksheet](/bookkeeping-and-taxes/schedule-c-worksheet)
* [Tracking Business Expenses](/bookkeeping-and-taxes/tracking-business-expenses)
* [The Jar](/invoicing-and-payments/the-jar)
***
*Still need help? [Contact us](mailto:hello@kneadapp.co)*